microAeth® / MA200
Data examples
DualSpot method and high concentration measurements
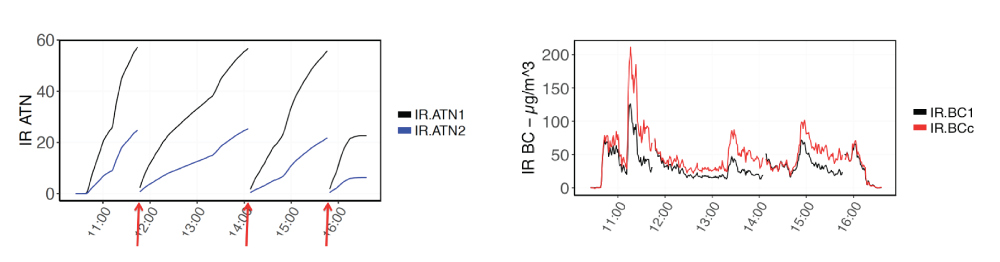
MA Series instruments have the patented DualSpot® loading compensation method built in. Particulates are collected on the primary measurement filter spot (represented in the first chart below as IR.ATN1) at a higher flow rate and also collected on a second measurement spot (represented below as IR.ATN2) at a lower flow rate. Based on the ratios of the two different spots, a real-time loading compensation factor can be calculated which can be used to compensate for any optical loading effects while providing additional information about aerosol optical properties. The uncompensated BC values are labeled below as IR.BC1, while the values that have been compensated using the DualSpot method are labeled IR.BCc. The charts below show three tape advances occurring. The graph of the original IR.BC1 data shows a visible gap in the BC data chart due to the loading effect at high filter loadings. The IR.BCc data shown is compensated and the gap in the original data is minimized.
Cross-comparison between MA series devices and photo-acoustic method
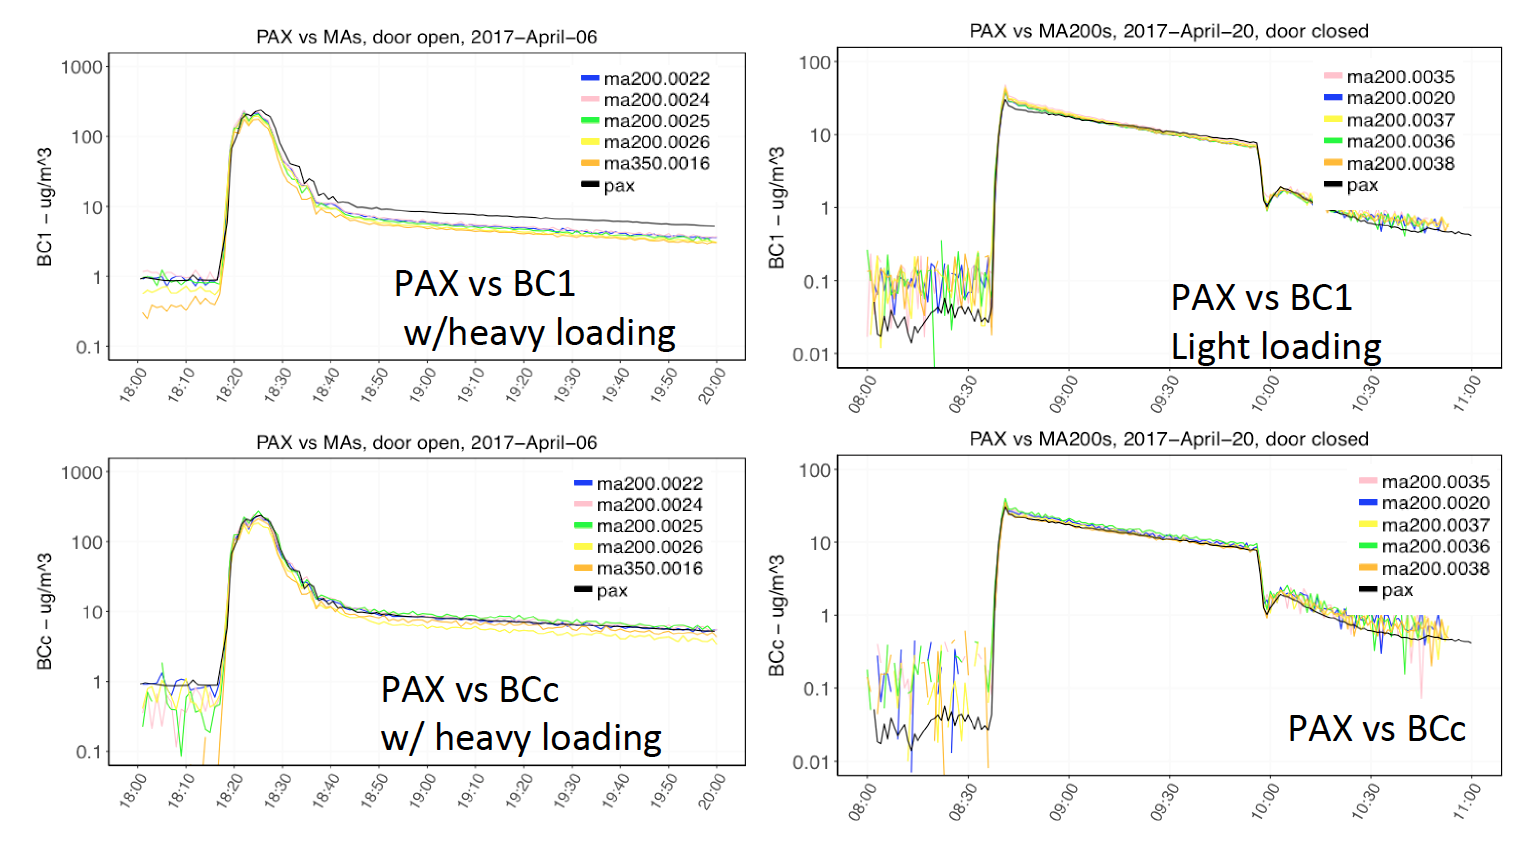
The charts below show comparisons between the PAX photoacoustic extinctiometer BC instrument and microAeth MA series instruments under conditions of high and low BC concentrations. The top two charts show DualSpot disabled and the second pair below show DualSpot enabled with improved agreement. In the top left chart the microAeth MA instruments are under-reporting compared to the photoacoustic data due to the high concentrations and the optical loading effect. In the chart directly below, with DualSpot enabled the MA instrument data is no longer underreporting and is in better agreement with the photo-acoustic data.
Mobile measurements on bicycle
MA200 data collected on a bicycle commute between Shinjuku, Tokyo and the more rural Tokorozawa Saitama Prefecture. The reverse commute occurred the next morning after collecting overnight data indoors. Data (including GPS coordinates) are collected every 5 minutes.
Traffic vs. tobacco smoke
The chart below shows motor vehicle traffic data heading to board a flight from New York to Los Angeles. Data collected at the beginning of the time period indicate traffic emissions as all optical wavelengths are overlaid. After the arrival of the flight at Los Angeles, the spectral response of the instrument shows stronger absorption at lower wavelengths while standing next to cigarette smokers, waiting outside for ground transportation at the terminal.